The issue occurs on Android 14 (works fine on Android 12 versions)
Issue Description :
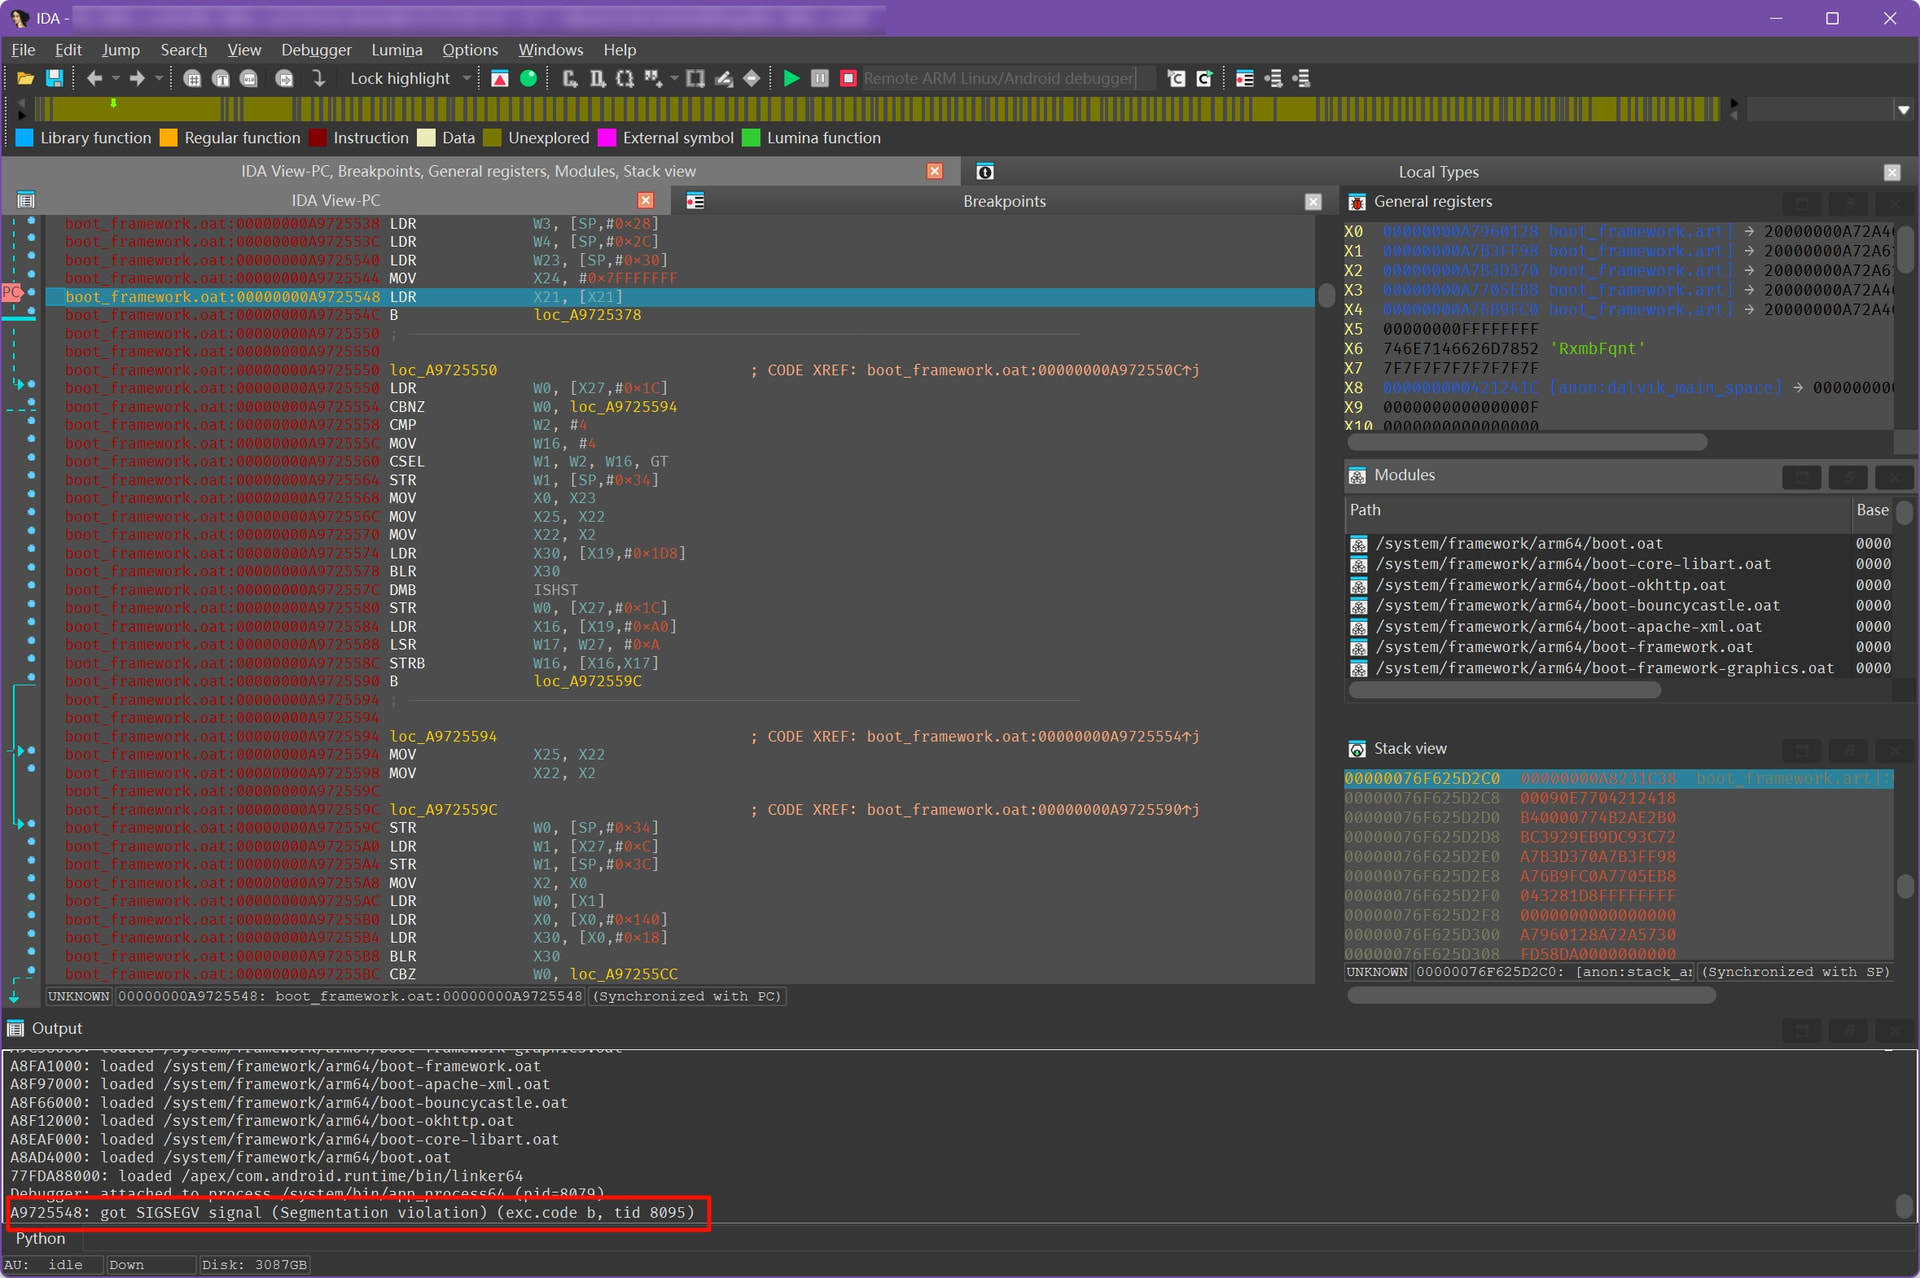
When using IDA Pro to debug processes on Android 14 devices, the target process consistently crashes during the boot-framework phase immediately after attachment and continue execution . The crash occurs at the following disassembly point:
boot_framework.oat base → 71FAC000
Thank you very much for the report. Does it happen in the emulator, real device (which?), or both? Were you able to track down the crash location to a line in the source code? If you step instead of continue, do you get the crash?
Sorry for the late response. My triggering environment is on a real device - I haven’t tested it on the emulator. The crash location shouldn’t have much relationship with the debugged application’s source code, because I encounter the same crash regardless of which application I’m debugging. Step debugging triggers a null pointer error that causes the crash and exit.
Thank you for the update and sorry for the unclear message previously. By “source code”, I meant the source of Android kernel or runtime (if it’s possible to find it).
Finding the corresponding source code is quite difficult, and IDA cannot decompile the corresponding symbols. My environment is Pixel 8 Magisk Root Android 14 (Build number AP1A.240305.019.A1), which should theoretically make it easy to reproduce this crash scenario.
I haven’t tried it; I’m not very familiar with lldb and gdb. I hope the compatibility issues on Android 14 can be fixed; otherwise, it will be quite troublesome as many new devices will be unable to be debugged.
I tried using gdbserver --multi, and then attached it with IDA. In this case, it did not crash. It seems that IDA’s Android server is not adapted for the new version of Android.
A quick follow up - this Android debugger issue is going to be fixed in the upcoming release, which is right around the corner. If you’d like to be among the very first to try it out - you’re welcome to join our beta program!
How to enroll in the beta, if you haven’t done so yet:
After I use the UI to attach to the process, it loads the libraries and successfully attaches to process “/system/bin/app_process64“ (see attached screenshot). If I step or continue the process, it throws exception that the original poster posted: 72A0EA5C: got SIGSEGV signal (Segmentation violation) (exc.code b, tid 25150).